


There is some nervousness in the capital markets about the growing possibility that a economic crisis is currently brewing and ends up affecting the world economy. The recent increase in the price of gold (+11,7% increase in May and June) or bitcoin (+93,3% in May and June) is a sign of the growing nervousness in the markets. The latest decisions of the Fed and the statements of its members suggest cuts in the Fed's reference rate despite the fact that unemployment in the US economy is at its lowest point since 1969 and that inflation is below the 2% target.
By Miami Diario Newsroom
In this situation, we intend to decipher the where we are in the business cycle and whether fears of a crisis and recession are justified. To do this, we are going to analyze several leading economic indicators that could be giving us clues about the future of world growth.
The blackest indicator: the yield curve
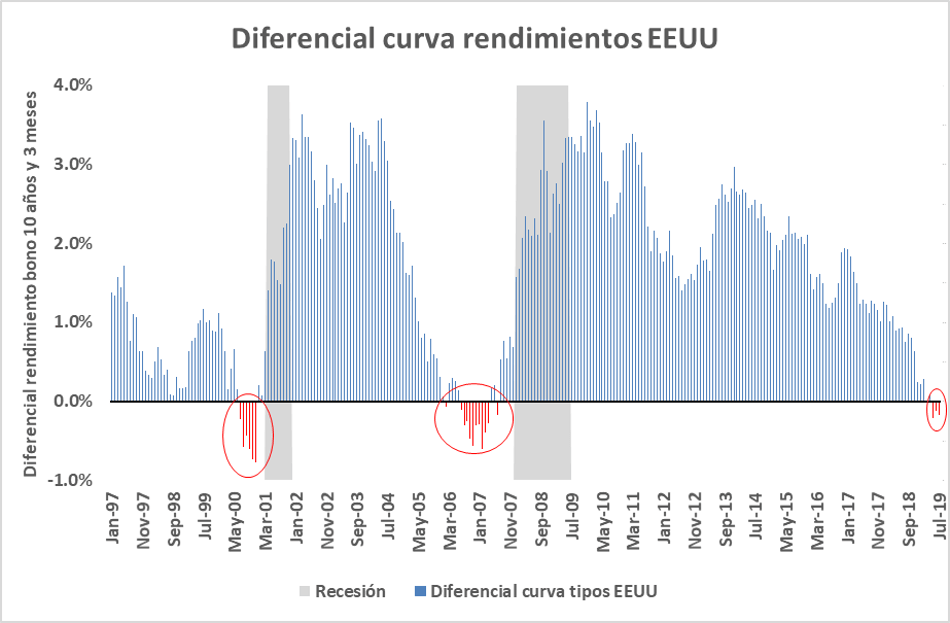
The slope or spread of the yield curve is one of the most reliable leading indicators. We are going to use the spread suggested by one of the researchers who has written the most on the predictive power of the yield curve. Estrella (1998) suggests that the best spread is the 10-year sovereign bond yield (capital market security) minus the 3-month bond yield (money market security).
For the US, once the spread is very close to zero or negative, a crisis has occurred in the next 24 months. Here we can see the current situation in the US together with the last two crises.

El interest rate spread turned negative in the US in March. Since then he has remained negative, already accumulating more than three months in negative territory. The 2001 dotcom boom recession took only 9 months to appear since the yield curve turned and only 4 months since the spread returned to positive territory.
For its part, the Great Recession of 2008-09 took place 23 months after the yield curve turned and 6 months after the spread returned to positive territory. Here we can see a graph that compares the evolution of the yield curve in the two previous crises and with the current situation.
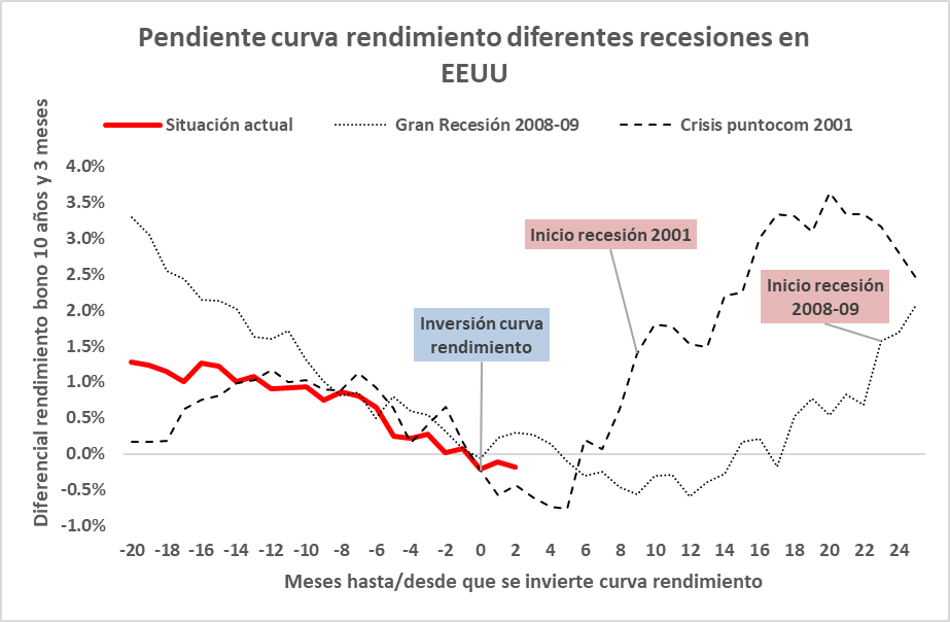
If the data of the last recessions can be extrapolated, and taking into account only this indicator, we could anticipate that the next crisis in the US will occur no sooner than 6 months and no later than 20 months. That is, a crisis would take place in the US at some point between January 2020 and March 2021.
But just as important as seeing when the yield curve inverts is seeing when it turns positive again. The return of the yield curve to a positive slope indicates that the pressures that keep the short-term rate high are easing due to the bankruptcy and disappearance of companies that badly need short-term funds. We could argue, once again supported by the data from the last two crises, that once the yield curve recovers its positive slope, the crisis would appear between 4 and 6 months later. In the present moment, the crisis does not seem to be imminent.
Elsewhere the outlook is not much better, the eurozone yield curve is still upward sloping but falling rapidly. Currently, it is at its lowest level since the 2008-09 crisis.

However, it is worth noting that despite how well this indicator performs in predicting crises in the US, it is far from being perfect or universally usable. For example, and as we have just seen, this indicator was unable to predict the sovereign debt crisis and recession that the eurozone suffered between 2011 and 2013. Although this episode could be seen as a secondary recession derived from the 2008-09 recession. Despite this, the yield curve was unusable on that occasion.
PMIs, a deteriorating indicator
The Purchasing Managers' Indices, PMI For its acronym in English, they have become one of the indicators most followed by the markets due to their very high correlation with economic growth and also due to their simplicity and speed of publication.
The indicator is constructed through a survey in which company purchasing managers are asked if they make more or fewer purchases from suppliers than in the previous period. If more than half of the purchasing managers indicate that they increased their purchases with respect to the previous period, it is considered that the economy will grow in the near future (indicator greater than 50). If, on the contrary, more than half of the managers indicate that they made fewer purchases than in the previous period, it is considered that the economy will have growth problems in the near future (indicator less than 50).
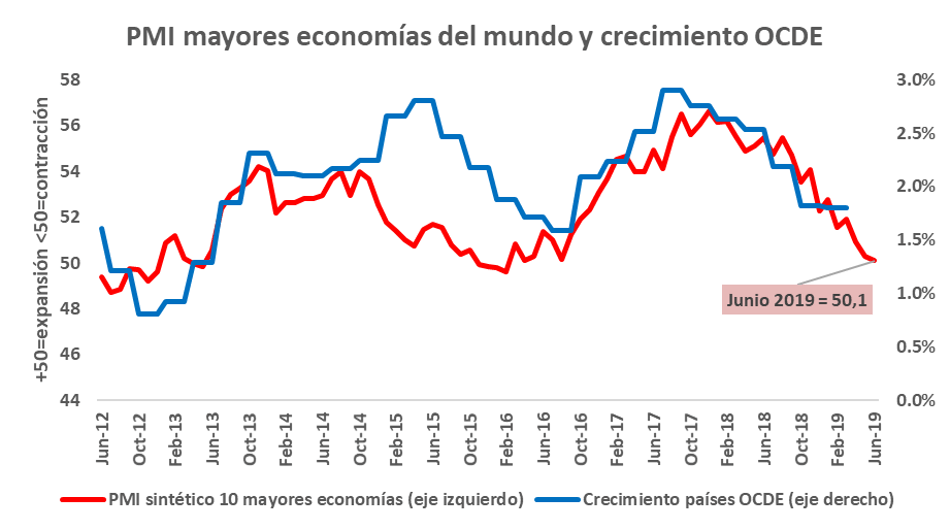
We have calculated the GDP-weighted average of the manufacturing PMIs of the 10 largest economies in the world. In other words, we have made a synthetic PMI which brings together 67,1% of world GDP. Our indicator shows aclear retracement from the high of 56,6 marked in December 2017. In June 2019 it marks 50,1, still positive, but with a clear downward trend. We can also see the high correlation with economic growth.
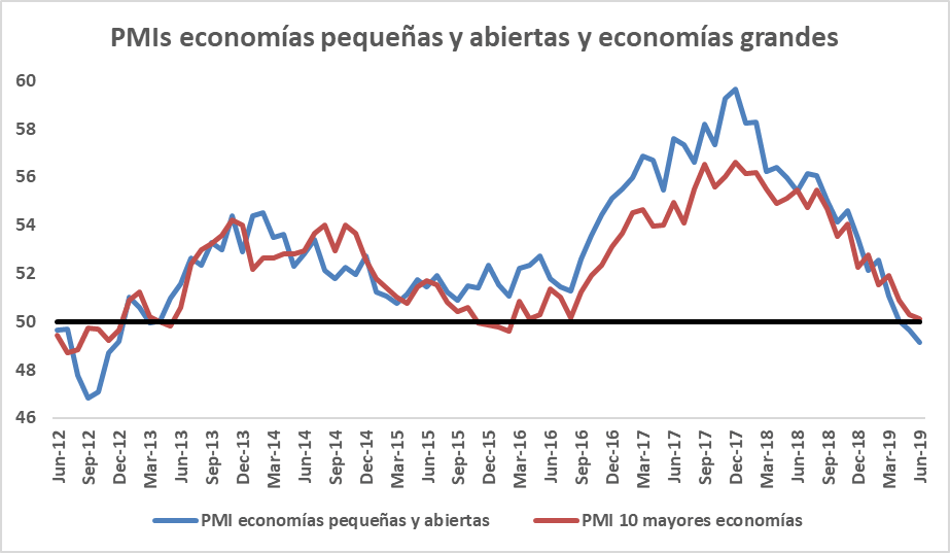
To analyze whether there are economic problems at a global level, it is also worth following the purchasing management indices of small economies open to trade. Large economies may have internal dynamics that for a time do not exhibit possible growth problems in the world economy. In small economies, we would expect possible global growth problems to loom some time in advance.
The PMIs of small economies and open to trade mark a period of contraction in the last two months. The deterioration of this indicator is faster in small and open economies than in large ones, this could indicate future growth problems worldwide.
Therefore, the purchasing management indices, despite the fact that they still do not clearly indicate the presence of a recession in the near future, are deteriorating rather rapidly.
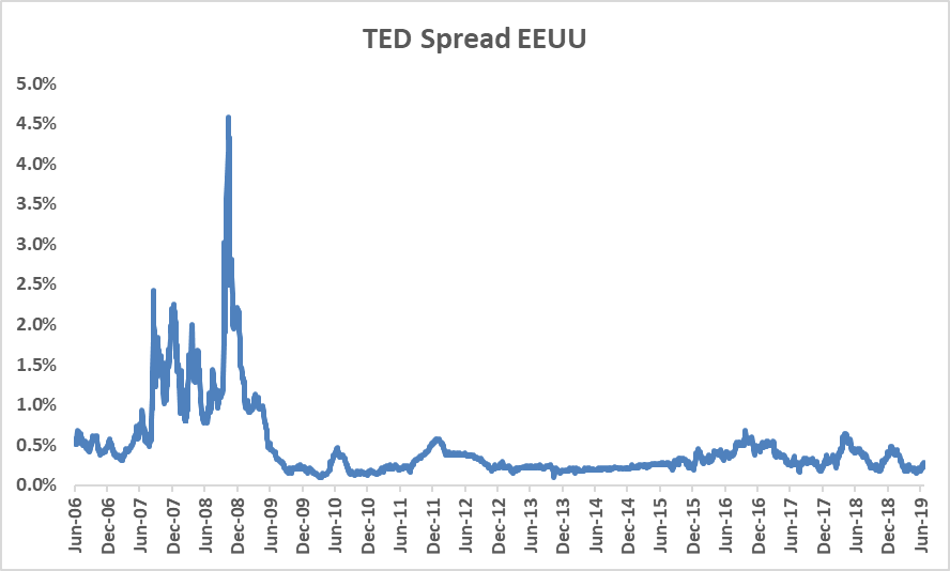
TED Spread
The TED Spread is the differential between the yield on the sovereign bond and the financing cost of the financial sector (Libor or equivalent). This indicator measures the financial sector risk premium. In times of economic expansion and financial calm, the spread tends to be close to zero. However, in times of financial stress preceding economic crises, the spread skyrockets. The TED Spread is located at relatively low levels in the US and it does not indicate financial stress or the possibility of a crisis in the short term.
Hours worked in industry
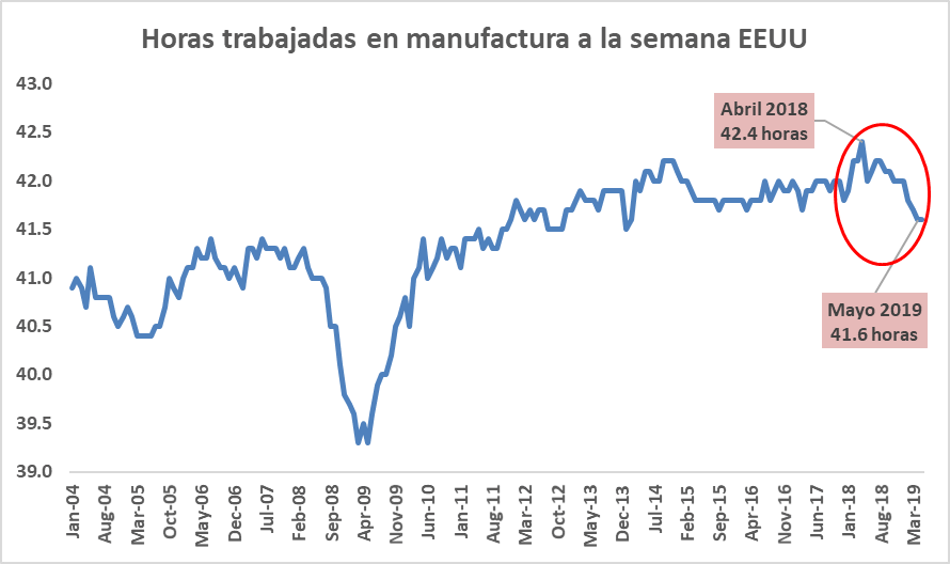
The average hours worked in the manufacturing sector could be a better leading indicator than unemployment. Many companies, faced with the drop in demand for their products, prefer to cut working hours rather than take a more drastic measure such as laying off their employees.
Of the last 12 economic crises in the US, this indicator was able to predict 10 of them. However, there is one big limitation in using this indicator, and that is the huge number of false positives it flags. In other words, it warns us too many times that there could be an economic crisis, in fact, it warns us many more times than the crises that actually exist. That is why this indicator should be used as a complement to other indicators.
In this sense, we see how in the US this indicator It has started to deteriorate slightly. The drop in average hours worked is the biggest since the 2008-09 crisis. Despite this, it is still relatively early to know if we are facing a false positive or a reliable warning signal.
On the good work of other indicators
There are other indicators that show how the US economy or the eurozone are in perfect condition. For example, economic growth in the US is solid and strong. Unemployment figures are very low both in the US and in the eurozone and are constantly falling. Stock market indices in the US are at record highs, driven by unusually high company profits, profits that also have an impact on increased wages for workers.
However, all of these bullish indicators are pro-cyclical and are usually at highs before an economic crisis takes place. Think about where all of these indicators were before the financial and economic meltdown of the 2008-09 crisis, all of them at record highs. Just before every recession in the US since World War II (11 recessions), unemployment was at a record low.
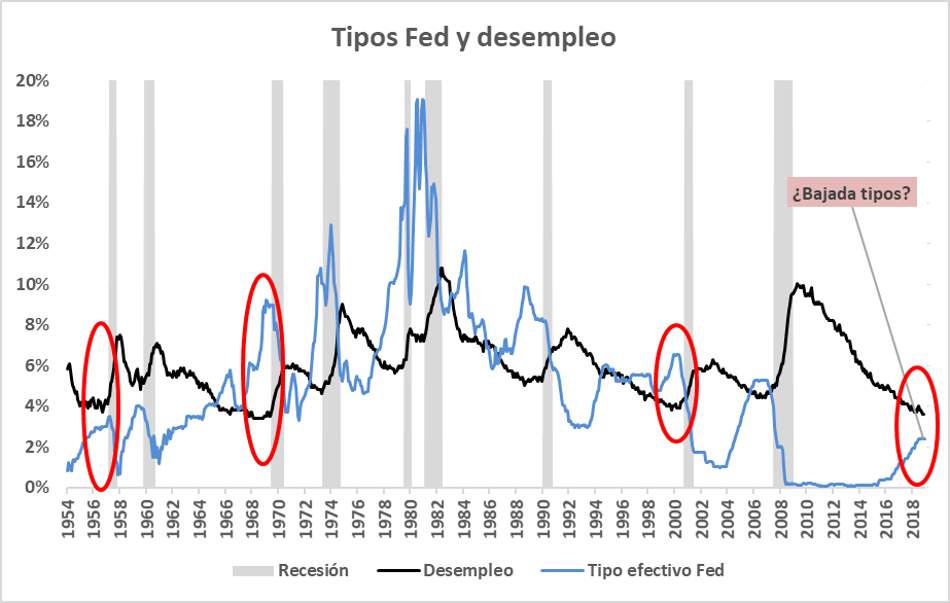
The Fed itself is observing the weakness of the US economy and has already signaled possible rate cuts in the near future. We have to mention that whenever the Fed has lowered rates with unemployment below 4% (like the current situation), an economic crisis has occurred almost immediately.
Conclusion
The indicators shown here are some of the leading indicators that we consider most sensitive to the economic cycle. Many more indicators can always be included in the analysis, such as credit dynamics, amount of money in circulation, corporate risk spreads, demand for cyclical goods, etc… For a more detailed analysis, I recommend reading the latest report we published on UFM Market Trends on the North American economy.
The indicators included here show weakness in the world economy and a possible crisis and recession in the North American economy and possibly also in Europe. The crisis and recession do not seem imminent, but it is close. With the yield curve in hand, the recession in the US could take place before 20 months and not before 6 months.
The global PMIs mark a clear slowdown in world growth,close to recession levels, although they are still on neutral ground. However, the TED Spread, which measures the stress to which the financial sector is subjected, is far from showing problems. Finally, the Fed anticipates problems by announcing possible cuts in the reference rate. In short, if our thesis is correct, there is still some time for economic agents to start preparing for an economic future with more shadows than lights.
Source: Infobae
You may also be interested:
Spanish financial group GVC opened a subsidiary in Miami under the name Ceres Global Advisory
Learn about the system to buy in Miami and that the product reaches your home
Miami Beach established maximum mileage rate for fiscal year 2019-2020